
Monitoring ArangoDB with Promotheus and Grafana
Estimated reading time: 5 minutes
Please consider monitoring your productive ArangoDB installation as part of the best practices strategy. It is effortlessly done using established services Prometheus for data collection and Grafana for visualisation and alerting.
Best practices
Many of us have come to experience database infrastructure like a solid rock to rely upon when the going gets rough. It is the mission statement of any database, that comes to my mind right now: Trust us with the data and … – and what, exactly?
It turns out that running a single instance, let alone a whole cluster of database servers, demands a good deal of attention, just as operating a car, an airplane etc does. There are sensors and instrumentation that are provided for every professional appliance, that needs monitoring and alertness to guarantee safety of investment and service.
In this article, I propose some best practices, when running ArangoDB installations. The provided guide is easily applied to any sort of ArangoDB deployment. This includes single instance, active-failover and cluster installations inside or outside Kubernetes.
Metrics export
Some obvious parameters, that obviously constitute trouble for a database daemon, include overall and ArangoDB memory consumption, overall and ArangoDB CPU utilisation and network utilisation. But one can do much better by monitoring a host of different metrics, which are exported directly by ArangoDB instances starting with 3.6 through the `_admin/metrics` API. The API exports metrics spanning from IO in bytes all the way to RocksDB file size in `prometheus` exporter syntax as described here.
Actual working setup
In the following and for simplicity sake, I will walk us through a cluster monitoring setup. I will assume a monitoring machine, `monitor`, that is running ubuntu 18.04 and a 3 node ArangoDB cluster, c01 through c03, with 3 agents (port 8531), 3 coordinators (port 8529) and 3 db servers (port 8530).
We’ll start by installing Prometheus node exporter on each on the cluster nodes running our cluster instances:
sudo apt install prometheus-node-exporterThis service automatically activates and starts. It is not a minimum requirement for monitoring but adds that extra valuable information about the general sanity of the operating system, that is hosting your ArangoDB instances. Now change to `monitor` to install the Prometheus collection and the Grafana server daemons:
sudo apt install prometheus grafana-serverThese services need of course to be configured now. So edit next `/etc/prometheus/prometheus.yml` and add to the end the following sections:
    - job_name: node_monitor
      static_configs:
      - targets: ['c01:9100', 'c02:9100', 'c03:9100']

    - job_name: arangodb
      scrape_interval: 5s
      metrics_path: /_admin/metrics/v2
      static_configs:
      - targets: ['c01:8529', 'c01:8530', 'c01:8531',
                  'c02:8529', 'c02:8530', 'c02:8531',
                  'c03:8529', 'c03:8530', 'c03:8531']
Now restart the Prometheus daemon
sudo systemctl restart prometheusDirect your browser now to `monitor:9090/targets` to check, if all targets show a green `UP` in the `State` columns.
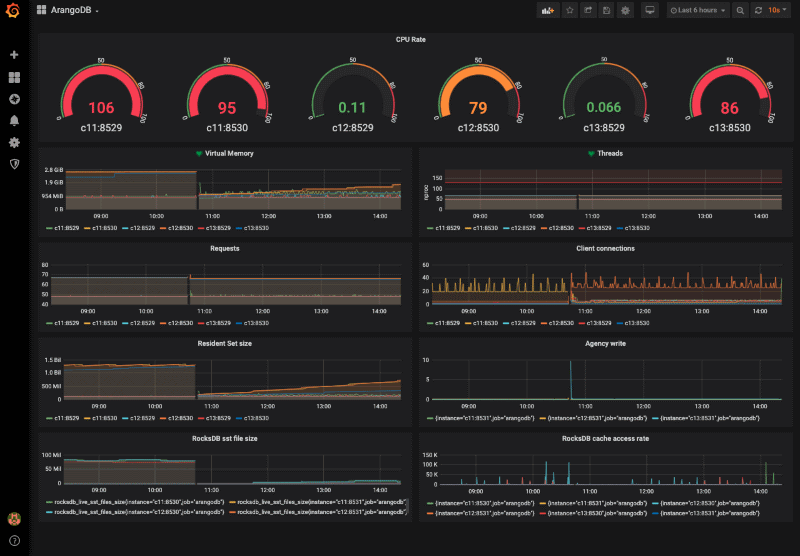
Let’s now pay a visit to the Grafana integration. Use your browser to access `monitor:3000`. You will initially be challenged to login with `admin` login and password respectively followed by specifying a new password for the `admin` user. Subsequently, choose `Configuration|Data Sources` from the left icon column to add a new `Prometheus` data source. Here the only thing that needs to be set is the field `URL` to that of the Prometheus server above, namely, `http://monitor:9090`
Next, hover over the `+` sign in the navigation column to click on `Import` to add the content of my dashboard to the field `Or paste JSON` and click on Load. Assign the name `ArangoDB` on the following page and click on `Import`. Et voilá, habemus dashboard! Click on the `ArangoDB` dashboard to inspect your new dashboard.
Security, TLS and Authentication
Of course, production environments and arguably development and staging likewise should only operate hardened services, including the monitoring infrastructure. This implies that one should only operate ArangoDB deployments utilising encryption and authentication.
The necessary adjustments for Prometheus and Grafana can be made through a host of configuration options. Keep in mind, that authenticated ArangoDB clusters do not allow username, password-authenticated access to agents or db servers. Just use the JWT secret file of your cluster to generate an access token like so:
arangodb auth header --auth.jwt-secret /path/to/secretThe string after `bearer` should be copied to the file `/etc/prometheus/prometheus.token` on `monitor` and then be included in the `arangodb` section of `/etc/prometheus/prometheus.yml` as follows:
    - job_name: arangodb
      scrape_interval: 5s
      metrics_path: /_admin/metrics/v2/
      bearer_token_file: /etc/prometheus/prometheus.token
      static_configs:
      - targets: ['c01:8529', 'c01:8530', 'c01:8531',
                  'c02:8529', 'c02:8530', 'c02:8531',
                  'c03:8529', 'c03:8530', 'c03:8531']
Be mindful, that the token file is only readable by the prometheus service and root. Likewise guard your prometheus and grafana installations to allow only encrypted and authenticated access. Their respective documentations offer great guidelines into getting that done.
Oftentimes, while valid TLS certificates are created for a service, their use within the cluster (among the nodes, monitoring, etc.) is not as easily doable. This has to do with the need that certificates only be related to a set of FQDNs and/or fixed IP addresses. Cluster internal IP addresses and names are however subject to change in many reasonable deployments and thus the strict enforcement of TLS is not possible. If however, the setup is such that the safe operation is guaranteed through encapsulation from outside, it is possible to relax the constraints to allow monitoring, for example, to work.
Prometheus and Grafana both allow one to work under such relaxed constraints. Add to the prometheus.yml above the following line to access Arangodb metrics endpoints with otherwise invalid TLS certificates:
insecure_skip_verify: trueOf course, both Grafana and Prometheus are configurable for TLS access themselves and should only be operated secured in this manner in productive environments. Documentation for TLS configuration of these services is found here and here.
Outlook
The dashboard is by no means a solution that fits all needs, please adjust it to your specific needs. Also expect official and community dashboards to show up over time.
Hear More from the Author
Use ArangoDB Agency as fault-tolerant persistent data store
Fundamentals and Best Practices of ArangoDB Cluster Administration
Continue Reading
Performance Impact of Meltdown and Spectre V1 Patches on ArangoDB
Using the WebUI AQL Editor – Basics
Milestone ArangoDB 3.4:
ArangoSearch – Information retrieval with ArangoDB
4 Comments
Leave a Comment
Get the latest tutorials, blog posts and news:
Thank you, would be great to see the same tutorial on K8s
Expect it within a couple of days. Will ping you, when it’s there.
Thanks for this, I would also like a k8s tutorial, did it ever come out? I couldn’t find it. It’d also be great if you shared your dashboard, or maybe post it to the grafana dashboard site.
Works like a charm, I also needed to add credentials to the YML file