

Detecting Complex Fraud Patterns with ArangoDB
Introduction
This article presents a case study of using AQL queries for detecting complex money laundering and financial crime patterns. While there have been multiple publications about the advantages of graph databases for fraud detection use cases, few of them provide concrete examples of implementing detection of complex fraud patterns that would work in real-world scenarios.
This case study is based on a third-party transaction data generator, which is designed to simulate realistic transaction graphs of any size. The generator disguises complex financial fraud patterns of two kinds:
- Circular money flows: a big amount of money is going through different nodes and comes back to the source node.
- Indirect money transfers: a big amount of money is sent from source node to a target node over a multi-layered network of intermediate accounts.
In this post, we demonstrate that AQL provides declarative, yet efficient means for detecting such patterns and showcase a set of ArangoDB features:
- Complex graph traversal and visualization
- Advanced AQL filtering and aggregation
- Query Parallelism
- The WINDOW function introduced in ArangoDB 3.8
Dataset
In the case study, the dataset we use is produced by a third-party generator of financial transaction data available at:
https://github.com/MGrin/transactions-graph-generator
The generator can produce any data size and thus is invaluable for testing fraud detection at a large scale. A sample dataset with 1.5 million transactions that we used for testing can also be downloaded from the following link and imported using arangorestore:
https://drive.google.com/file/d/1P8XFFzEn3nOHaQUwJcExp5uYuwOIAZJO/view?usp=sharing

In ArangoDB, we represent the generated dataset by 3 vertex collections, one for each entity type:
- clients
- companies
- atms.
Each entity is identified by a UUID-based key and described by a JSON document. For example, we have a client entity with the key d942a1fe-ad32-46da-9630-4622c4c01354 and describe it as:
{
  "first_name": "Sharice",
  "last_name": "Quinn",
  "age": 36,
  "email": "conservatives1812@gmail.com",
  "occupation": "Tool Maker",
  "political_views": "Libertarian",
  "nationality": "Ecuadorian",
  "university": "Florida Polytechnic University (Florida Poly or FPU)",
  "academic_degree": "None",
  "address": "1348 San Felipe Square",
  "postal_code": 62492,
  "country": "United States",
  "city": "Prior Lake",
  "label": "Sharice Quinn"
}
Transactions are modeled by an edge collection connecting the vertices representing the sources and the destinations of the transactions. Each document in the collection has the special attributes _from and _to, which act as references to the source and destination nodes, and a set of further attributes describing the time, the amount and the currency of the transaction, e.g.:
{
  "_from": "clients/fddbced9-0d3f-4dbf-84dd-61ea27a718e9",
  "_to": "clients/72cef499-ba34-4360-ab65-c9a8e01e5060",
  "date": "2015-12-10",
  "time": "04:35:05.632384",
  "amount": 96.01706505950199,
  "currency": "USD"
}
Cycle Detection
One of the money laundering patterns is a circular money flow. Money is being transferred from one account to another and eventually lands back in the originator’s account.
To detect such a circular flow, we begin at a particular transaction from account A to account B and monitor transactions that eventually link back to account A. We check for transactions from account B at a later time but with a similar amount of money. We continue following the transactions from account to account to check if we return to account A. A sequence of transactions showing this money laundering pattern would result in a graph such as this one, which results from the AQL query in the following section.

Detecting a Circular Money Flow
A very simple AQL query can detect if there is a circle of transactions starting at a given transaction @firstTrans:
LET t = DOCUMENT(@firstTrans)
FOR v, e, p IN 2..10 OUTBOUND t._to transactions
   FILTER e._to == t._from
   LET cycle = APPEND([t], p.edges)
   RETURN cycle
The query attempts a deep graph traversal up to level 10 and uses the filter `e._to == t._from` to check that we end up at the account where we started.
However, such a query won’t work in practice, because in a realistic data set we will have thousands of transactions per account and a traversal of depth 3 would already need to visit billions of paths. Also, there will be a lot of accidental circular paths in the transaction graph that do not necessarily represent a circular money flow.
In a circular money flow, money is retransferred after it was received, so we can filter the transactions that happen within a certain time window after the first one. Also, the amount of money being retransferred is similar to the original amount. So we can optimize our query by applying corresponding filters on the dates and amount attributes of all transactions on the path:
// Example:
LET t = DOCUMENT(@firstTrans)
LET beginDate = t.date
LET endDate = DATE_ADD(t.date, 100, "day")
LET lowerAmount = t.amount * 0.95
   LET upperAmount = t.amount * 1.01
   FOR v, e, p IN 2..10 OUTBOUND t._to transactions
      FILTER (p.edges[*].date ALL >= beginDate) AND
             (p.edges[*].date ALL <= endDate) AND
             (p.edges[*].amount ALL >= lowerAmount) AND
             (p.edges[*].amount ALL <= upperAmount) AND
             (e._to == t._from)
      LET cycle = APPEND([t], p.edges)
// All of the variables are returned as a performance measure
      RETURN { beginDate, endDate, lowerAmount, upperAmount, cycle }
The AQL optimizer recognizes that these conditions must be satisfied by all edges in the path and performs an optimization that avoids traversing the edges that do not satisfy the filter. As a result, this query can perform a deep traversal on a large dataset within milliseconds.
For example, within just 10ms we can find a cycle of length 8 beginning at
@firstTrans = ‘transactions/0976884d-b460-406e-8d18-7ddf4e56fc92’
Generate a Graph Visualization
Thanks to the built-in graph viewer of the WebUI we can easily generate a graph with our results by extracting and returning the edges from our results:
// Example:
// @firstTrans = 'transactions/0976884d-b460-406e-8d18-7ddf4e56fc92'
LET cycles = (
   LET t = DOCUMENT(@firstTrans)
   LET beginDate = t.date
   LET endDate = DATE_ADD(t.date, 100, "day")
   LET lowerAmount = t.amount * 0.95
   LET upperAmount = t.amount * 1.01
   FOR v, e, p IN 2..10 OUTBOUND t._to transactions
      FILTER (p.edges[*].date ALL >= beginDate) AND
             (p.edges[*].date ALL <= endDate) AND
             (p.edges[*].amount ALL >= lowerAmount) AND
             (p.edges[*].amount ALL <= upperAmount) AND
             (e._to == t._from)
      LET cycle = APPEND([t], p.edges)
	// All of the variables are returned as a performance measure
      RETURN { beginDate, endDate, lowerAmount, upperAmount, cycle })
FOR c IN cycles
   FILTER c.beginDate != null AND c.endDate != null
          AND c.lowerAmount != null AND c.upperAmount != NULL
   FOR e IN c.cycle
      RETURN e
Checking Suspicious Clients
As a result of flagging a transaction as suspicious, we may decide it is necessary to investigate all transactions of the client in question for other fraudulent behavior. This is accomplished with a small change to our initial FOR loop. We change the initial transaction lookup to a graph traversal that starts at a specified client and traverses all of their transactions using the same criteria from the first query.:
// @client="clients/8bf6c520-b0e3-470d-9470-f8d3c3ce1f52"
LET cycles = (
   FOR c, t IN OUTBOUND @client transactions
      LET beginDate = t.date
      LET endDate = DATE_ADD(t.date, 30, "day")
      LET lowerAmount = t.amount * 0.95
      LET upperAmount = t.amount * 1.01
      FOR v, e, p IN 2..10 OUTBOUND t._to transactions
         FILTER (p.edges[*].date ALL >= beginDate) AND
                (p.edges[*].date ALL <= endDate) AND
                (p.edges[*].amount ALL >= lowerAmount) AND
                (p.edges[*].amount ALL <= upperAmount) AND
                (e._to == t._from)
         LET cycle = APPEND([t], p.edges)
         RETURN { beginDate, endDate, lowerAmount, upperAmount, cycle })
FOR c IN cycles
   FILTER c.beginDate != null AND c.endDate != null
      AND c.lowerAmount != null AND c.upperAmount != null
   FOR e IN c.cycle
      RETURN e

Checking Every Transaction
Performing analysis on a single transaction or client is very important, but analyzing all of the available transactions to start getting a picture of just how widespread fraud is in your dataset is where some serious business value is gained.
We can scan the entire data set for possible cycles, e.g., check all transactions with a large enough amount or are recent enough. We can significantly reduce the execution of such queries by employing parallel traversals. As a result, it takes only 15s to detect all cyclic money flows in our sample data set on a 4-CPU core machine. Traversal parallelization was introduced in ArangoDB 3.7 and allows for executing nested traversals in parallel on a single server and a clustered environment. The amount of value received from this optimization is dependent on the number of available cores. See the release notes and graph traversal documentation for more information.
FOR t IN transactions
   FILTER t.amount > 10000
   LET beginDate = t.date
   LET endDate = DATE_ADD(t.date, 100, "day")
   LET lowerAmount = t.amount * 0.95
   LET upperAmount = t.amount * 1.01
   FOR v, e, p IN 2..10 OUTBOUND t._to transactions
      OPTIONS { parallelism : 4 }
      FILTER (p.edges[*].date ALL >= beginDate) AND
             (p.edges[*].date ALL <= endDate) AND
             (p.edges[*].amount ALL >= lowerAmount) AND
             (p.edges[*].amount ALL <= upperAmount) AND
             (e._to == t._from)
      LET cycle = APPEND([t], p.edges)
      RETURN { beginDate, endDate, lowerAmount, upperAmount, cycle }
As before, we can easily generate a graph with our results by extracting the edges from our results:
LET res =
(FOR t IN transactions
   FILTER t.amount > 10000
   LET beginDate = t.date
   LET endDate = DATE_ADD(t.date, 100, "day")
   LET lowerAmount = t.amount * 0.95
   LET upperAmount = t.amount * 1.01
   FOR v, e, p IN 2..10 OUTBOUND t._to transactions
      OPTIONS { parallelism : 4 }
      FILTER (p.edges[*].date ALL >= beginDate) AND
             (p.edges[*].date ALL <= endDate) AND
             (p.edges[*].amount ALL >= lowerAmount) AND
             (p.edges[*].amount ALL <= upperAmount) AND
             (e._to == t._from)
      LET cycle = APPEND([t], p.edges)
      RETURN { beginDate, endDate, lowerAmount, upperAmount, cycle })
FOR r IN res
   FILTER r.beginDate != null AND r.endDate != null AND r.lowerAmount != null AND r.upperAmount != NULL
   FOR e IN r.cycle
      RETURN e
Now we can see an excellent visualization of all the money cycles in the dataset:
Money Flow Pattern Detection
Another money laundering pattern hidden in the generated data set is indirect money transfers over multiple accounts. Money is split into smaller amounts and sent to the destination over multiple layers of intermediate accounts. We can try to detect such a pattern by looking for a sequence of transactions from one account to multiple other accounts that are relatively close in time and are followed by retransfers of a similar amount of money to further accounts.

The problem of detecting a money flow network is more complicated than detecting circular money flows because in this case, our results are not just separate paths in the graph, but rather an entire subgraph. Our idea of detecting such graphs is based on solving the problem in two phases:
- First detecting and marking suspicious transactions that are potentially part of such money flows
- Traverse the graph of suspicious transactions to detect if they build a connected network with a single source and destination
Identifying Suspicious Transactions
For the first part, we can use the WINDOW function introduced in ArangoDB 3.8 to aggregate over accounts in a specific time range efficiently. We look at the time window from 5 days before and up to 30 days after the current transaction and check if it is the first one in this range so that it begins the pattern:
FOR acc1, t1 IN OUTBOUND @clientId transactions
   LET beginDate = DATE_TIMESTAMP(t1.date)
   WINDOW beginDate WITH { preceding : "P5D", following : "P30D" }
      AGGREGATE seq = UNIQUE(t1)
   FILTER seq[0]._key == t1._key
   RETURN { seq: seq[*]._key }
Of course, there will likely be a lot of such transaction sequences for each account. For detecting potentially fraudulent behavior, it is also important to check if the money is being transferred to multiple accounts and whether the recipient of the money retransfers it further. So we add a subquery, which checks whether each recipient has transferred at least 90% of the received money within the following 30 days.
/*
clientId: "clients/8fc3b93f-a27e-428c-b5a4-3ec2c242e31b"
*/
FOR acc1, t1 IN OUTBOUND @clientId transactions
LET beginDate = DATE_TIMESTAMP(t1.date)
WINDOW beginDate WITH { preceding : "P5D", following : "P30D" }
AGGREGATE seq = UNIQUE(t1)
FILTER seq[0]._key == t1._key
FILTER COUNT_UNIQUE(seq[*]._to) > 1
LET retransferCnt = COUNT(
FOR t2 IN seq
LET receivedAmount =
SUM(FOR n, t3 IN OUTBOUND t2._to transactions
FILTER t3.date >= t2.date
AND t3.date <= DATE_ADD(t2.date, "P30D")
RETURN t3.amount)
FILTER receivedAmount > t2.amount * 0.9
RETURN 1)
FILTER retransferCnt == COUNT(seq)
RETURN { seq: seq[*]._key }
The query identifies patterns of potential participation of the client in the money flows. Still, to visualize the pattern from the beginning to the end through all intermediate layers, we will perform such analysis for all clients. In practice, since the transactions constituting a pattern are close in time, such analysis can be applied incrementally, each time processing only relatively recent transactions.
We can also make our search more efficient by applying additional filters:
- Ignore all small transactions, i.e. with an amount < 100
- The money transfers in a sequence are of similar size
- The overall transferred amount in the sequence exceeds 1000
- The average time between the money transfers in the sequence does not exceed 5 days
Also instead of returning the suspicious patterns, as a result, we instead mark the suspicious edges, so we can traverse over them afterward to visualize entire money flows. More specifically, in each suspicious edge, we write an attribute outboundLead pointing to the transaction that leads the pattern it belongs to:
FOR c IN clients
  LET suspPatterns =
     (FOR acc1, t1 IN OUTBOUND c transactions
         FILTER t1.amount > 100 AND !t1.atm
         LET beginDate = DATE_TIMESTAMP(t1.date)
         WINDOW beginDate WITH { preceding : "P5D", following : "P30D" }
         AGGREGATE seq1 = UNIQUE(t1)
         LET seq = seq1[* FILTER ABS(CURRENT.amount - t1.amount)
                            < t1.amount * 0.1]
         FILTER seq[0]._key == t1._key
         FILTER COUNT_UNIQUE(seq[*]._to) > 1
         FILTER SUM(seq[*].amount) > 1000
         LET endDate = MAX(seq[*].date), seqLen = COUNT(seq)
         FILTER DATE_DIFF(beginDate, endDate, "day") / seqLen <= 5
         LET retransferCnt =
            COUNT(FOR t2 IN seq
               LET transferAmount =
                  SUM(FOR n, t3 IN OUTBOUND t2._to transactions
                         FILTER t3.date >= t2.date
                           AND t3.date <= DATE_ADD(t2.date, "P30D")
                         RETURN t3.amount)
               FILTER transferAmount > t2.amount * 0.9 RETURN 1)
         FILTER retransferCnt / seqLen >= 0.8
         RETURN { lead: t1._key, seq: seq[*]._key })
    FOR p IN suspPatterns
       FOR t IN p.seq
          UPDATE t WITH { outboundLead : p.lead } IN transactions
Next, we detect suspicious inbound money flow patterns in an analogous way and annotate the suspicious edges with the attribute inboundLead:
FOR c IN clients
  LET patterns =
     (FOR acc1, t1 IN INBOUND c transactions
         FILTER t1.amount > 100 AND !t1.atm
         LET beginDate = DATE_TIMESTAMP(t1.date)
         WINDOW beginDate WITH { preceding : "P5D", following : "P30D" }
         AGGREGATE seq1 = UNIQUE(t1)
         LET seq = seq1[* FILTER ABS(CURRENT.amount - t1.amount)
                            < t1.amount * 0.1]
         FILTER seq[0]._key == t1._key
         FILTER COUNT_UNIQUE(seq[*]._from) > 1
         FILTER SUM(seq[*].amount) > 1000
         LET endDate = MAX(seq[*].date), seqLen = COUNT(seq)
         FILTER DATE_DIFF(beginDate, endDate, "day") / seqLen <= 5
         LET retransferCnt =
            COUNT(FOR t2 IN seq
               LET receivedAmount =
                  SUM(FOR n, t3 IN INBOUND t2._from transactions
                         FILTER t3.date <= t2.date
                           AND t3.date >= DATE_SUBTRACT(t2.date, "P30D")
                         RETURN t3.amount)
               FILTER receivedAmount > t2.amount * 0.9 RETURN 1)
         FILTER retransferCnt / seqLen >= 0.8
         RETURN { lead: t1._key, seq: seq[*]._key })
    FOR p IN patterns
       FOR t IN p.seq
          UPDATE t WITH { inboundLead : p.lead } IN transactions
Visualizing the Money Flows
Now we are ready to link the pieces together. Our goal is to run graph traversals for each money flow pattern from the initial source to the final destination:
- First, we identify the leading transactions of money flow patterns. Each money flow begins with a sequence of outbound transfers, which are not retransferred of received money. We collect such transactions into the leads array.
- Each transaction t1 in the leads array begins one independent money flow pattern, which originates in the client t1._from. To collect the entire money flow, we perform a graph traversal starting from t1._from that follows suspicious transactions.
- In each money flow path, we expect each transaction to be happening within a limited time frame after the previous one. By adding a corresponding condition in the PRUNE clause, we heavily limit the number of possible paths to be traversed.
- We can reduce the combinatorial explosion of traversing various paths in the graph traversal by using only the lead edges to reach the next layer of the pattern.
- PRUNE causes the pruned paths to be returned as part of the result. Since we are not interested in the pruned paths, we have to repeat a part of the PRUNE condition in the FILTER to get rid of them.
LET leads = (
   FOR t IN transactions
      FILTER t.outboundLead == t._key AND t.inboundLead == null
      LIMIT 1
      RETURN t)

FOR t1 IN leads
   LET client = t1._from
   LET leadKey = t1._key
   FOR n, e, p IN 2..6 OUTBOUND client transactions
      PRUNE LENGTH(p.edges) == 1 ? e.outboundLead != leadKey :
        (LENGTH(p.edges) > 1 AND
           (e.date < p.edges[LENGTH(p.edges)-2].date OR
            e.date > DATE_ADD(p.edges[LENGTH(p.edges)-2].date, "P30D") OR
            e.inboundLead != e._key)
        )
      FILTER e.inboundLead != null
        AND e.date >= p.edges[LENGTH(p.edges)-2].date
        AND e.date <= DATE_ADD(p.edges[LENGTH(p.edges)-2].date, "P30D")
      RETURN p

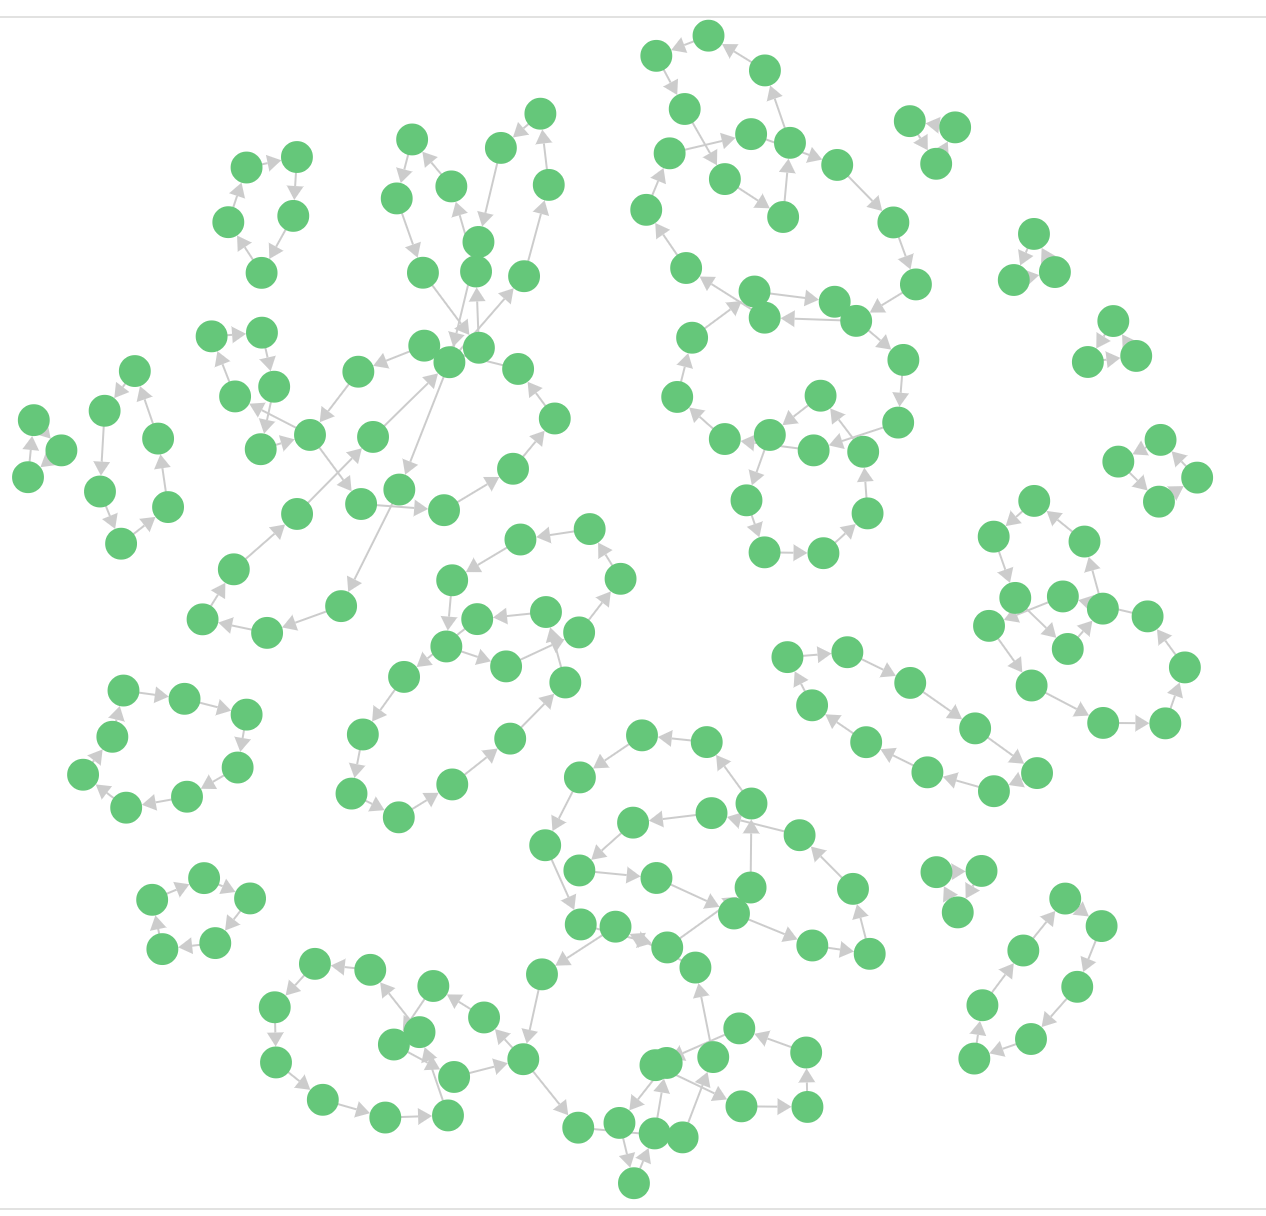
To see more patterns just increase the limit in the first subquery:

Conclusion
As you can see now, the bad guys can get pretty tricky with how they move around money but not tricky enough to get past a well-done AQL query!
The ability to nest graph traversals while aggregating data all in a single query allows for efficiently gaining insights that may have otherwise been impossible to obtain and shows the power of the ArangoDB query language. Although we developed relatively complex queries, they are very declarative and constitute just a small fraction of the complexity that would be necessary to implement a corresponding algorithm using a programming language.
As promised, we covered a lot in this article, and if you would like to continue learning more about fraud detection, be sure to check out our Fraud Detection white paper:
Scalable Fraud Detection With Multi-Model
If you would like to see fraud detection in action at scale, we also have a fraud detection example guide available through ArangoGraph, which you can get started with for free at cloud.arangodb.com!
If you want to get hands-on with other ArangoDB learning content, be sure to check out our ever-growing library of interactive tutorial notebooks.
Get the latest tutorials, blog posts and news: