


Semantic Tweet Analytics with Tweetmood
We developed a tool for the tweet analytics called Tweetmood. The Tweetmood Engine is based on an R package we developed internally, aRangodb, which allows to easily interface R with an existing ArangoDB server instance.
In this case study we will present how we integrated ArangoDB within Tweetmood for tweet analytics.
Tweetmood is composed by several interconnected microservices which can be schematically represented as shown below:

The Twitter Social Adapter interacts with the Twitter API to retrieve data about certain discussions (based on hashtags, mentions or plain searches) and returns tweets and information related to the tweets’ users.
In particular the application was used to monitor political discussions retrieving tweets by hashtags or plain searches related to Italian political parties.
The incoming data from the Twitter API are in JSON format. The Twitter Social Adapter filter out the data fields that are of no use for the subsequent analysis step and generates a new bunch of JSON representing the distillation of the original tweets. At the same time, the users contained into the tweets are extrapolated to generate new ‘users’ JSON documents.
Example of User document:

Example of Tweet document:


The aRangodb Factor
By their nature, data representing tweets and corresponding users are easily representable using a graph.
The following example represents the code used by the Tweetmood Engine to save tweets and users. The engine uses the Kode aRangodb package to interact with the remote ArangoDB server.
Furthermore, from the typical tweets contents (hashtags and mentioned users) we can widen the knowledge base with another collection of documents, the Hashtags, and with two new relationships:
mentioned_in, that represent edges with starting collectionusersand end collectiontweets;contained_in, that represent edges with starting collection the new onehashtagsand end collectiontweets.
To add this information to the existing graph the Tweetmood Engine can use again the aRangodb package:
The final graph is then composed by the elements represented in the following figure:
- three collections of documents { users, tweets, hashtags }
- three relationships {wrote(users, tweets), mentioned_in(users, tweets), contained(hashtags, tweets) }.


Hashtags co-occurrence analysis
One of the analysis executed by the Tweetmood Engine is the hashtags co-occurrence analysis. This is basically an application of the well-known association rule analysis, and with the use of the aRangodb package this can be done with few lines of code.
The resulting list of association rules of the tweets contained in the ArangoDB instance (we were monitoring discussions about Italian politics) are shown in the next table. The interpretation of the table can be done in this way:
- {LHS} => {RHS} where the rule should be read as “in a tweet containing the hashtag/s {LHS}, the tweet contains also the hashtag/s {RHS}”
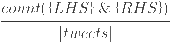
- The support column represents the frequency, over all the analyzed tweets, of occurrence of both rules:
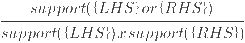
- The confidence represents intuitively the conditional probability P({LHS} | {RHS})
- The lift represents a measure of performance of the rule (higher values are better)

Those results can be represented themselves as a graph where it is possible to see the representation of the rules of the table.
Using this tweet analytics we retrieve new information, itemsets of hashtags (as collection) and association rules between itemsets (as relation) that we can save into the ArangoDB instance.
