
ArangoDB v3.8 reached End of Life (EOL) and is no longer supported.
This documentation is outdated. Please see the most recent version at docs.arangodb.com
Monitoring & Metrics in ArangoGraph
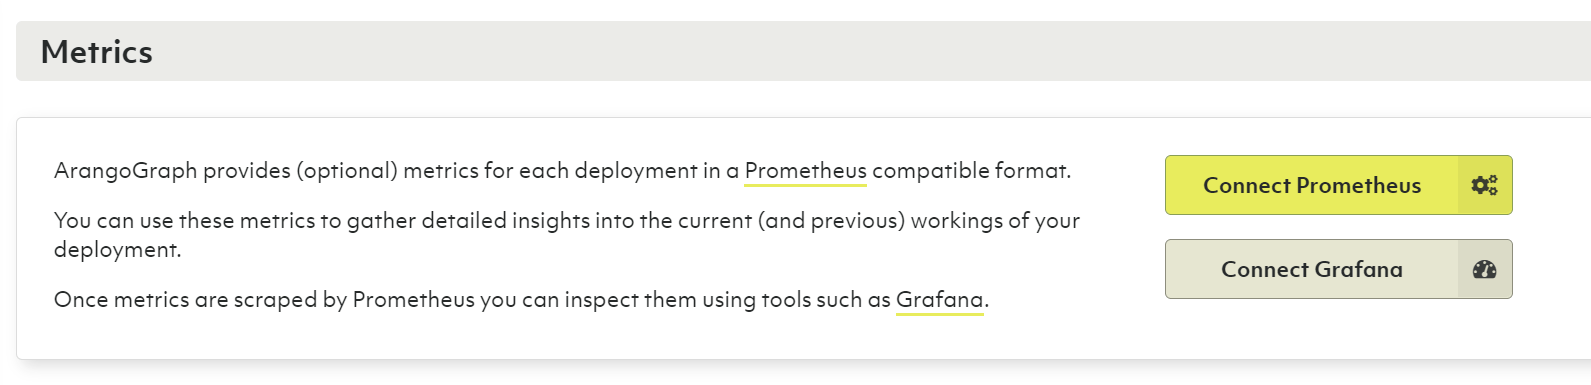
The ArangoGraph Insights Platform provides metrics for each deployment in a Prometheus compatible format. You can use these metrics to gather detailed insights into the current and previous states of your deployment. Once metrics are collected by Prometheus, you can inspect them using tools such as Grafana.
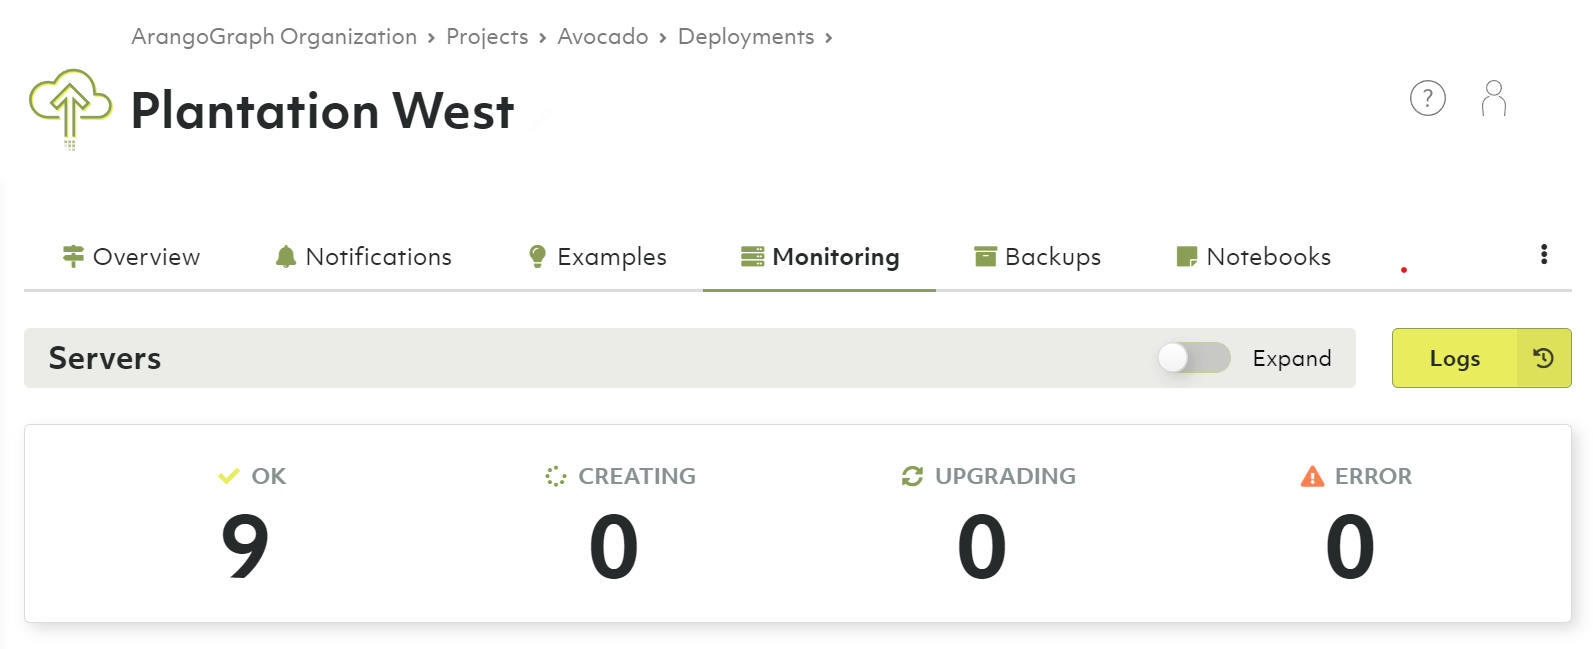
To get started, select an existing deployment from within a project and open the Monitoring tab.
Metrics tokens
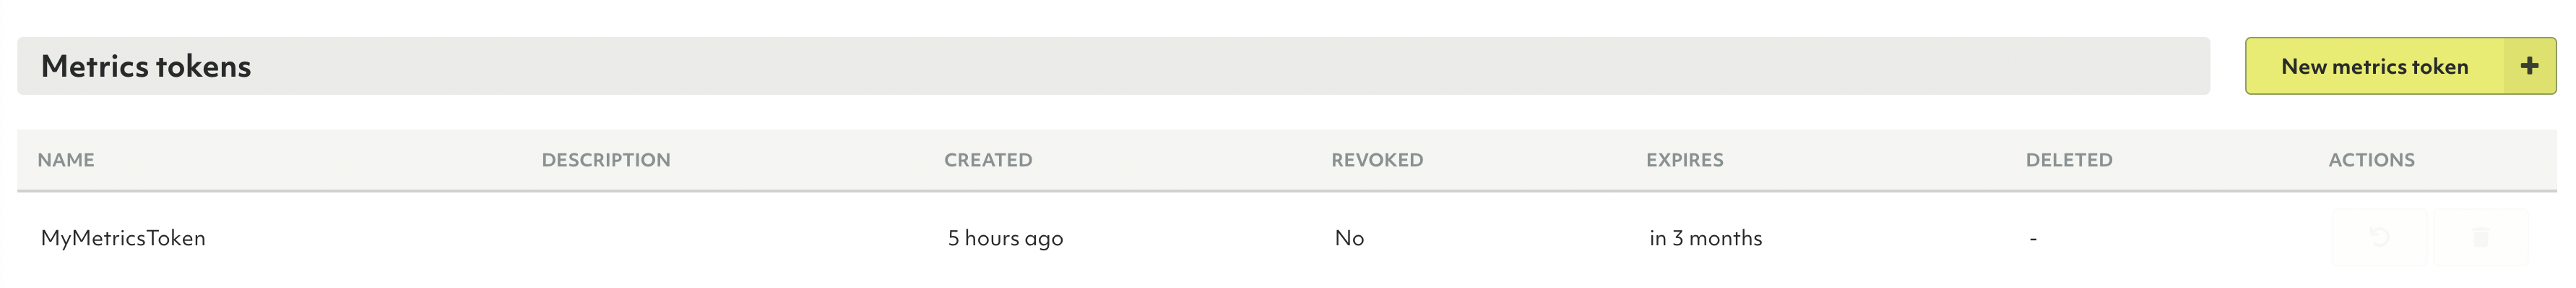
The Metrics tokens section allows you to create a new metrics token, which is required for connecting to Prometheus.
- To create a metrics token, click New metrics token.
- For Name, enter a name for the metrics token.
- Optionally, you can also enter a Short description.
- Select the Lifetime of the metrics token.
- Click Create.
How to connect Prometheus
- In the Metrics section, click Connect Prometheus.
- Create the
prometheus.ymlfile with the following content: ```yaml global: scrape_interval: 60s scrape_configs:- job_name: ‘deployment’
bearer_token: ‘
' scheme: 'https' static_configs: - targets: [‘6775e7d48152.arangodb.cloud:8829’] tls_config: insecure_skip_verify: true ```
- job_name: ‘deployment’
bearer_token: ‘
- Start Prometheus with the following command:
docker run -d \
-p 9090:9090 -p 3000:3000 --name prometheus \
-v $(pwd)/prometheus.yml:/etc/prometheus/prometheus.yml:ro \
prom/prometheus
This command also opens a port 3000 for Grafana. In a production environment, this is not needed and not recommended to have it open.
How to connect Grafana
- Start Grafana with the following command:
docker run -d \ --network container:prometheus \ grafana/grafana - Go to
localhost:3000and log in with the following credentials:- For username, enter admin.
- For password, enter admin.
After the initial login, make sure to change your password.
- To add a data source, click Add your first data source and then do the following:
- Select Prometheus.
- For HTTP URL, enter
http://localhost:9090. - Click Save & Test.
- To add a dashboard, open the menu and click Create and then Import.
- Download the Grafana dashboard for ArangoGraph.
- Copy the contents of the
main.jsonfile into the Import via panel json field in Grafana. - Click Load.