
ArangoDB v3.8 reached End of Life (EOL) and is no longer supported.
This documentation is outdated. Please see the most recent version at docs.arangodb.com
Monitoring ArangoDB using collectd
Problem
The ArangoDB web interface shows a nice summary of the current state. I want to see similar numbers in my monitoring system so I can analyze the system usage post mortem or send alarms on failure.
Solution
Collectd is an excellent tool to gather all kinds of metrics from a system, and deliver it to a central monitoring like Graphite and / or Nagios.
Ingredients
For this recipe you need to install the following tools:
- collectd >= 5.4.2 The aggregation Daemon
- kcollectd for inspecting the data
Configuring collectd
For aggregating the values we will use the cURL-JSON plug-in.
We will store the values using the Round-Robin-Database writer(RRD) which kcollectd can later on present to you.
We assume your collectd comes from your distribution and reads its config from /etc/collectd/collectd.conf. Since this file tends to become pretty unreadable quickly, we use the include mechanism:
<Include "/etc/collectd/collectd.conf.d">
  Filter "*.conf"
</Include>
This way we can make each metric group on compact set config files. It consists of three components:
- loading the plug-in
- adding metrics to the TypesDB
- the configuration for the plug-in itself
rrdtool
We will use the Round-Robin-Database as storage backend for now. It creates its own database files of fixed size for each specific time range. Later you may choose more advanced writer-plug-ins, which may do network distribution of your metrics or integrate the above mentioned Graphite or your already established monitoring, etc.
For the RRD we will go pretty much with defaults:
# Load the plug-in:
LoadPlugin rrdtool
<Plugin rrdtool>
   DataDir "/var/lib/collectd/rrd"
#  CacheTimeout 120
#  CacheFlush 900
#  WritesPerSecond 30
#  CreateFilesAsync false
#  RandomTimeout 0
#
# The following settings are rather advanced
# and should usually not be touched:
#   StepSize 10
#   HeartBeat 20
#   RRARows 1200
#   RRATimespan 158112000
#   XFF 0.1
</Plugin>
cURL JSON
Collectd comes with a wide range of metric aggregation plug-ins.
Many tools today use JSON as data formatting grammar; so does ArangoDB.
Therefore a plug-in offering to fetch JSON documents via HTTP is the perfect match to query ArangoDBs administrative Statistics interface:
# Load the plug-in:
LoadPlugin curl_json
# we need to use our own types to generate individual names for our gauges:
# TypesDB "/etc/collectd/arangodb_types.db"
<Plugin curl_json>
  # Adjust the URL so collectd can reach your arangod:
  <URL "http://localhost:8529/_db/_system/_admin/statistics">
    # Set your authentication to Aardvark here:
    User "root"
    # Password "bar"
    <Key "http/requestsTotal">
       Type "gauge"
    </Key>
    <Key "http/requestsPatch">
       Type "gauge"
    </Key>
    <Key "http/requestsPut">
       Type "gauge"
    </Key>
    <Key "http/requestsOther">
       Type "gauge"
    </Key>
    <Key "http/requestsAsync">
       Type "gauge"
    </Key>
    <Key "http/requestsPost">
       Type "gauge"
    </Key>
    <Key "http/requestsOptions">
       Type "gauge"
    </Key>
    <Key "http/requestsHead">
       Type "gauge"
    </Key>
    <Key "http/requestsGet">
       Type "gauge"
    </Key>
    <Key "http/requestsDelete">
       Type "gauge"
    </Key>


    <Key "system/minorPageFaults">
       Type "gauge"
    </Key>
    <Key "system/majorPageFaults">
       Type "gauge"
    </Key>
    <Key "system/userTime">
       Type "gauge"
    </Key>
    <Key "system/systemTime">
       Type "gauge"
    </Key>
    <Key "system/numberOfThreads">
       Type "gauge"
    </Key>
    <Key "system/virtualSize">
       Type "gauge"
    </Key>
    <Key "system/residentSize">
       Type "gauge"
    </Key>
    <Key "system/residentSizePercent">
       Type "gauge"
    </Key>

    <Key "server/threads/running">
       Type "gauge"
    </Key>
    <Key "server/threads/queued">
       Type "gauge"
    </Key>
    <Key "server/threads/working">
       Type "gauge"
    </Key>
    <Key "server/threads/blocked">
       Type "gauge"
    </Key>
    <Key "server/uptime">
       Type "gauge"
    </Key>
    <Key "server/physicalMemory">
       Type "gauge"
    </Key>

    <Key "server/v8Context/available">
       Type "gauge"
    </Key>
    <Key "server/v8Context/max">
       Type "gauge"
    </Key>
    <Key "server/v8Context/busy">
       Type "gauge"
    </Key>
    <Key "server/v8Context/dirty">
       Type "gauge"
    </Key>
    <Key "server/v8Context/free">
       Type "gauge"
    </Key>

    <Key "client/totalTime/count">
       Type "client_totalTime_count"
    </Key>
    <Key "client/totalTime/sum">
       Type "client_totalTime_sum"
    </Key>
    <Key "client/totalTime/counts/0">
       Type "client_totalTime_counts0"
    </Key>

    <Key "client/bytesReceived/count">
       Type "client_bytesReceived_count"
    </Key>
    <Key "client/bytesReceived/sum">
       Type "client_bytesReceived_sum"
    </Key>
    <Key "client/bytesReceived/counts/0">
       Type "client_bytesReceived_counts0"
    </Key>

    <Key "client/requestTime/count">
       Type "client_requestTime_count"
    </Key>
    <Key "client/requestTime/sum">
       Type "client_requestTime_sum"
    </Key>
    <Key "client/requestTime/counts/0">
       Type "client_requestTime_counts0"
    </Key>

    <Key "client/connectionTime/count">
       Type "client_connectionTime_count"
    </Key>
    <Key "client/connectionTime/sum">
       Type "client_connectionTime_sum"
    </Key>
    <Key "client/connectionTime/counts/0">
       Type "client_connectionTime_counts0"
    </Key>

    <Key "client/queueTime/count">
       Type "client_queueTime_count"
    </Key>
    <Key "client/queueTime/sum">
       Type "client_queueTime_sum"
    </Key>
    <Key "client/queueTime/counts/0">
       Type "client_queueTime_counts0"
    </Key>

    <Key "client/bytesSent/count">
       Type "client_bytesSent_count"
    </Key>
    <Key "client/bytesSent/sum">
       Type "client_bytesSent_sum"
    </Key>
    <Key "client/bytesSent/counts/0">
       Type "client_bytesSent_counts0"
    </Key>

    <Key "client/ioTime/count">
       Type "client_ioTime_count"
    </Key>
    <Key "client/ioTime/sum">
       Type "client_ioTime_sum"
    </Key>
    <Key "client/ioTime/counts/0">
       Type "client_ioTime_counts0"
    </Key>

    <Key "client/httpConnections">
       Type "gauge"
    </Key>
  </URL>
</Plugin>
To circumvent the shortcoming of the curl_JSON plug-in to only take the last path element as name for the metric, we need to give them a name using our own types.db file in /etc/collectd/arangodb_types.db:
client_totalTime_count           value:GAUGE:0:9223372036854775807
client_totalTime_sum             value:GAUGE:U:U
client_totalTime_counts0         value:GAUGE:U:U

client_bytesReceived_count       value:GAUGE:0:9223372036854775807
client_bytesReceived_sum         value:GAUGE:U:U
client_bytesReceived_counts0     value:GAUGE:U:U

client_requestTime_count         value:GAUGE:0:9223372036854775807
client_requestTime_sum           value:GAUGE:U:U
client_requestTime_counts0       value:GAUGE:U:U

client_connectionTime_count      value:GAUGE:0:9223372036854775807
client_connectionTime_sum        value:GAUGE:U:U
client_connectionTime_counts0    value:GAUGE:U:U

client_queueTime_count           value:GAUGE:0:9223372036854775807
client_queueTime_sum             value:GAUGE:U:U
client_queueTime_counts0         value:GAUGE:U:U

client_bytesSent_count           value:GAUGE:0:9223372036854775807
client_bytesSent_sum             value:GAUGE:U:U
client_bytesSent_counts0         value:GAUGE:U:U

client_ioTime_count              value:GAUGE:0:9223372036854775807
client_ioTime_sum                value:GAUGE:U:U
client_ioTime_counts0            value:GAUGE:U:U
Please note that you probably need to uncomment this line from the main collectd.conf:
# TypesDB "/usr/share/collectd/types.db" "/etc/collectd/my_types.db"
in order to make it still load its main types definition file.
Rolling your own
You may want to monitor your own metrics from ArangoDB. Here is a simple example how to use the config:
{
 "testArray":[1,2],
 "testArrayInbetween":[{"blarg":3},{"blub":4}],
 "testDirectHit":5,
 "testSubLevelHit":{"oneMoreLevel":6}
}
This config snippet will parse the JSON above:
<Key "testArray/0">
  Type "gauge"
  # Expect: 1
</Key>
<Key "testArray/1">
  Type "gauge"
  # Expect: 2
</Key>
<Key "testArrayInbetween/0/blarg">
  Type "gauge"
  # Expect: 3
</Key>
<Key "testArrayInbetween/1/blub">
  Type "gauge"
  # Expect: 4
</Key>
<Key "testDirectHit">
  Type "gauge"
  # Expect: 5
</Key>
<Key "testSubLevelHit/oneMoreLevel">
  Type "gauge"
  # Expect: 6
</Key
Get it served
Now we will (re)start collectd so it picks up our configuration:
/etc/init.d/collectd start
We will inspect the syslog to revalidate nothing went wrong:
Mar  3 13:59:52 localhost collectd[11276]: Starting statistics collection and monitoring daemon: collectd.
Mar  3 13:59:52 localhost systemd[1]: Started LSB: manage the statistics collection daemon.
Mar  3 13:59:52 localhost collectd[11283]: Initialization complete, entering read-loop.
Collectd adds the hostname to the directory address, so now we should have files like these:
-rw-r--r-- 1 root root 154888 Mar 2 16:53 /var/lib/collectd/rrd/localhost/curl_json-default/gauge-numberOfThreads15M.rrd
Now we start kcollectd to view the values in the RRD file:
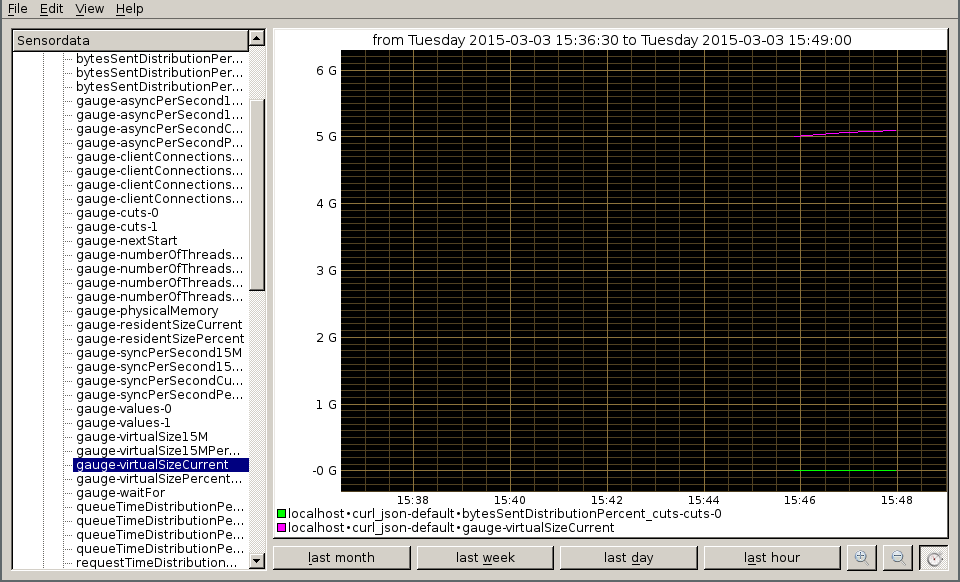
Since we started putting values in just now, we need to choose ‘last hour’ and zoom in a little more to inspect the values.
Finished with this dish, wait for more metrics to come in other recipes.