
ArangoDB v3.8 reached End of Life (EOL) and is no longer supported.
This documentation is outdated. Please see the most recent version at docs.arangodb.com
Reducing the Memory Footprint of ArangoDB servers
The changes suggested here can be useful to reduce the memory usage of ArangoDB servers, but they can cause side-effects on performance and other aspects. Do not apply any of the changes suggested here before you have tested them in in a development or staging environment.
ArangoDB’s memory usage can be restricted and the CPU utilization be reduced by different configuration options:
- storage engine
- edge cache
- server statistics
- background threads
- V8 (JavaScript features)
- operating system / memory allocator (Linux)
There are settings to make it run on systems with very limited resources, but they may also be interesting for your development machine if you want to make it less taxing for the hardware and do not work with much data. For production environments, we recommend to use less restrictive settings, to benchmark your setup and fine-tune the settings for maximal performance.
Let us assume our test system is a big server with many cores and a lot of memory. However, we intend to run other services on this machine as well. Therefore we want to restrict the memory usage of ArangoDB. By default, ArangoDB will try to make use of up to all of the available RAM. Using memory accesses instead of disk accesses is faster and in the database business performance rules. ArangoDB comes with a default configuration with that in mind. But sometimes being a little less grabby on system resources may still be fast enough, for example if your working data set is not huge. The goal is to reduce the overall memory footprint.
There are two big areas, which might eat up memory:
- Buffers & Caches
- WAL (Write Ahead Log)
WAL & Write Buffers
RocksDB writes into memory buffers mapped to on-disk blocks first. At some point, the memory buffers will be full and have to be written to disk. In order to support high write loads, RocksDB might open a lot of these memory buffers.
Under normal write load, the write buffers will use less than 1 GByte of memory. If you are tight on memory, or your usage pattern does not require this, you can reduce these RocksDB settings:
--rocksdb.max-total-wal-size 1024000
--rocksdb.write-buffer-size 2048000
--rocksdb.max-write-buffer-number 2
--rocksdb.total-write-buffer-size 67108864
--rocksdb.dynamic-level-bytes false
Above settings will
- restrict the number of outstanding in-memory write buffers
- limit the memory usage to around 100 MByte
During import or updates, the memory consumption may still grow bigger. On the other hand, these restrictions can have a large negative impact on the maximum write performance and will lead to severe slowdowns. You should not go below the numbers above.
Block Cache
--rocksdb.block-cache-size 33554432
--rocksdb.enforce-block-cache-size-limit true
These settings are the counterpart of the settings from the previous section. As soon as the memory buffers have been persisted to disk, answering read queries implies to read them back into memory. Data blocks, which are already read, can be stored in an in-memory block cache, for faster subsequent accesses. The block cache basically trades increased RAM usage for less disk I/O, so its size does not only affect memory usage, but can also affect read performance.
The above option will limit the block cache to a few megabytes. If possible, this setting should be configured as large as the hot-set size of your dataset. These restrictions can also have a large negative impact on query performance.
Index and Filter Block Cache
Index and filter blocks are not cached by default, which means that they do
not count towards the --rocksdb.block-cache-size limit. Enable the option
--rocksdb.cache-index-and-filter-blocks to include them in the cap.
There are additional options you can enable to avoid that the index and filter blocks get evicted from cache.
--rocksdb.cache-index-and-filter-blocks`
--rocksdb.cache-index-and-filter-blocks-with-high-priority
--rocksdb.pin-l0-filter-and-index-blocks-in-cache
--rocksdb.pin-top-level-index-and-filter
Also see:
Edge-Cache
--cache.size 10485760
This option limits the ArangoDB edge cache to 10 MB. If you do not have a graph use-case and do not use edge collections, it is possible to use the minimum without a performance impact. In general, this should correspond to the size of the hot-set of edges.
AQL Query Memory Usage
In addition to all the buffers and caches above, AQL queries will use additional memory during their execution, to process your data and build up result sets. This memory is used during the query execution only and will be released afterwards, in contrast to the held memory for buffers and caches.
By default, queries will build up their full results in memory. While you can fetch the results batch by batch by using a cursor, every query needs to compute the entire result first before you can retrieve the first batch. The server also needs to hold the results in memory until the corresponding cursor is fully consumed or times out. Building up the full results reduces the time the server has to work with collections at the cost of main memory.
In ArangoDB version 3.4 we introduced streaming cursors with somewhat inverted properties: less peak memory usage, longer access to the collections. Streaming is possible on document level, which means that it can not be applied to all query parts. For example, a MERGE() of all results of a subquery can not be streamed (the result of the operation has to be built up fully). Nonetheless, the surrounding query may be eligible for streaming.
Aside from streaming cursors, ArangoDB offers the possibility to specify a
memory limit which a query should not exceed. If it does, the query will be
aborted. Memory statistics are checked between execution blocks, which
correspond to lines in the explain output. That means queries which require
functions may require more memory for intermediate processing, but this will not
kill the query because the memory.
The startup option to restrict the peak memory usage for each AQL query is
--query.memory-limit. This is a per-query limit, i.e. at maximum each AQL query is allowed
to use the configured amount of memory. To set a global memory limit for
all queries together, use the --query.global-memory-limit setting.
You can also use LIMIT operations in AQL queries to reduce the number of documents that need to be inspected and processed. This is not always what happens under the hood, as some operations may lead to an intermediate result being computed before any limit is applied.
Statistics
The server collects statistics regularly, which is displayed in the web interface. You will have a light query load every few seconds, even if your application is idle, because of the statistics. If required, you can turn it off via:
--server.statistics false
This setting will disable both the background statistics gathering and the statistics APIs. To only turn off the statistics gathering, you can use
--server.statistics-history false
That leaves all statistics APIs enabled but still disables all background work done by the statistics gathering.
JavaScript & Foxx
JavaScript is executed in the ArangoDB process using the embedded V8 engine:
- Backend parts of the web interface
- Foxx Apps
- Foxx Queues
- GraphQL
- JavaScript-based transactions
- User-defined AQL functions
There are several V8 contexts for parallel execution. You can think of them as a thread pool. They are also called isolates. Each isolate has a heap of a few gigabytes by default. You can restrict V8 if you use no or very little JavaScript:
--javascript.v8-contexts 2
--javascript.v8-max-heap 512
This will limit the number of V8 isolates to two. All JavaScript related requests will be queued up until one of the isolates becomes available for the new task. It also restricts the heap size to 512 MByte, so that both V8 contexts combined can not use more than 1 GByte of memory in the worst case.
V8 for the Desperate
You should not use the following settings unless there are very good reasons, like a local development system on which performance is not critical or an embedded system with very limited hardware resources!
--javascript.v8-contexts 1
--javascript.v8-max-heap 256
Using the settings above, you can reduce the memory usage of V8 to 256 MB and just one thread. There is a chance that some operations will be aborted because they run out of memory in the web interface for instance. Also, JavaScript requests will be executed one by one.
If you are very tight on memory, and you are sure that you do not need V8, you can disable it completely:
--javascript.enabled false
--foxx.queues false
In consequence, the following features will not be available:
- Backend parts of the web interface
- Foxx Apps
- Foxx Queues
- GraphQL
- JavaScript-based transactions
- User-defined AQL functions
Note that JavaScript / V8 is automatically disabled for DB-Server and Agency nodes in a cluster without these limitations. They apply only to single server instances and Coordinator nodes. You should not disable V8 on Coordinators because certain cluster operations depend on it.
Concurrent operations
Starting with ArangoDB 3.8 one can limit the number of concurrent operations being executed on each Coordinator. Reducing the amount of concurrent operations can lower the RAM usage on Coordinators. The startup option for this is:
--server.ongoing-low-priority-multiplier
The default for this option is 4, which means that a Coordinator with t
scheduler threads can execute up to 4 * t requests concurrently. The
minimal value for this option is 1.
Also see Preventing cluster overwhelm.
CPU usage
We can not really reduce CPU usage, but the number of threads running in parallel. Again, you should not do this unless there are very good reasons, like an embedded system. Note that this will limit the performance for concurrent requests, which may be okay for a local development system with you as only user.
The number of background threads can be limited in the following way:
--arangosearch.threads-limit 1
--rocksdb.max-background-jobs 4
--server.maintenance-threads 3
--server.maximal-threads 5
--server.minimal-threads 1
In general, the number of threads is determined automatically to match the capabilities of the target machine. However, each thread requires at least 8 MB of stack memory when running ArangoDB on Linux, so having a lot of concurrent threads around will need a lot of memory, too. Reducing the number of server threads as in the example above can help reduce the memory usage by thread, but will sacrifice throughput.
In addition, the following option will make logging synchronous, saving one dedicated background thread for the logging:
--log.force-direct true
This is not recommended unless you only log errors and warnings.
Examples
If you don’t want to go with the default settings, you should first adjust the size of the block cache and the edge cache. If you have a graph use case, you should go for a larger edge cache. For example, split the memory 50:50 between the block cache and the edge cache. If you have no edges, then go for a minimal edge cache and use most of the memory for the block cache.
For example, if you have a machine with 40 GByte of memory and you want to restrict ArangoDB to 20 GB of that, use 10 GB for the edge cache and 10 GB for the block cache if you use graph features.
Please keep in mind that during query execution additional memory will be used for query results temporarily. If you are tight on memory, you may want to go for 7 GB each instead.
If you have an embedded system or your development laptop, you can use all of the above settings to lower the memory footprint further. For normal operation, especially production, these settings are not recommended.
Linux System Configuration
The main deployment target for ArangoDB is Linux. As you have learned above
ArangoDB and its innards work a lot with memory. Thus its vital to know how
ArangoDB and the Linux kernel interact on that matter. The linux kernel offers
several modes of how it will manage memory. You can influence this via the proc
filesystem, the file /etc/sysctl.conf or a file in /etc/sysctl.conf.d/ which
your system will apply to the kernel settings at boot time. The settings as
named below are intended for the sysctl infrastructure, meaning that they map
to the proc filesystem as /proc/sys/vm/overcommit_memory.
A vm.overcommit_memory setting of 2 can cause issues in some environments
in combination with the bundled memory allocator ArangoDB ships with (jemalloc).
The allocator demands consecutive blocks of memory from the kernel, which are also mapped to on-disk blocks. This is done on behalf of the server process (arangod). The process may use some chunks of a block for a long time span, but others only for a short while and therefore release the memory. It is then up to the allocator to return the freed parts back to the kernel. Because it can only give back consecutive blocks of memory, it has to split the large block into multiple small blocks and can then return the unused ones.
With an vm.overcommit_memory kernel settings value of 2, the allocator may
have trouble with splitting existing memory mappings, which makes the number
of memory mappings of an arangod server process grow over time. This can lead to
the kernel refusing to hand out more memory to the arangod process, even if more
physical memory is available. The kernel will only grant up to vm.max_map_count
memory mappings to each process, which defaults to 65530 on many Linux
environments.
Another issue when running jemalloc with vm.overcommit_memory set to 2 is
that for some workloads the amount of memory that the Linux kernel tracks as
committed memory also grows over time and never decreases. Eventually,
arangod may not get any more memory simply because it reaches the configured
overcommit limit (physical RAM * overcommit_ratio + swap space).
The solution is to
modify the value of vm.overcommit_memory
from 2 to either 0 or 1. This will fix both of these problems.
We still observe ever-increasing virtual memory consumption when using
jemalloc regardless of the overcommit setting, but in practice this should not
cause any issues. 0 is the Linux kernel default and also the setting we recommend.
For the sake of completeness, let us also mention another way to address the
problem: use a different memory allocator. This requires to compile ArangoDB
from the source code without jemalloc (-DUSE_JEMALLOC=Off in the call to cmake).
With the system’s libc allocator you should see quite stable memory usage. We
also tried another allocator, precisely the one from libmusl, and this also
shows quite stable memory usage over time. What holds us back to change the
bundled allocator are that it is a non-trivial change and because jemalloc has
very nice performance characteristics for massively multi-threaded processes
otherwise.
Testing the Effects of Reduced I/O Buffers
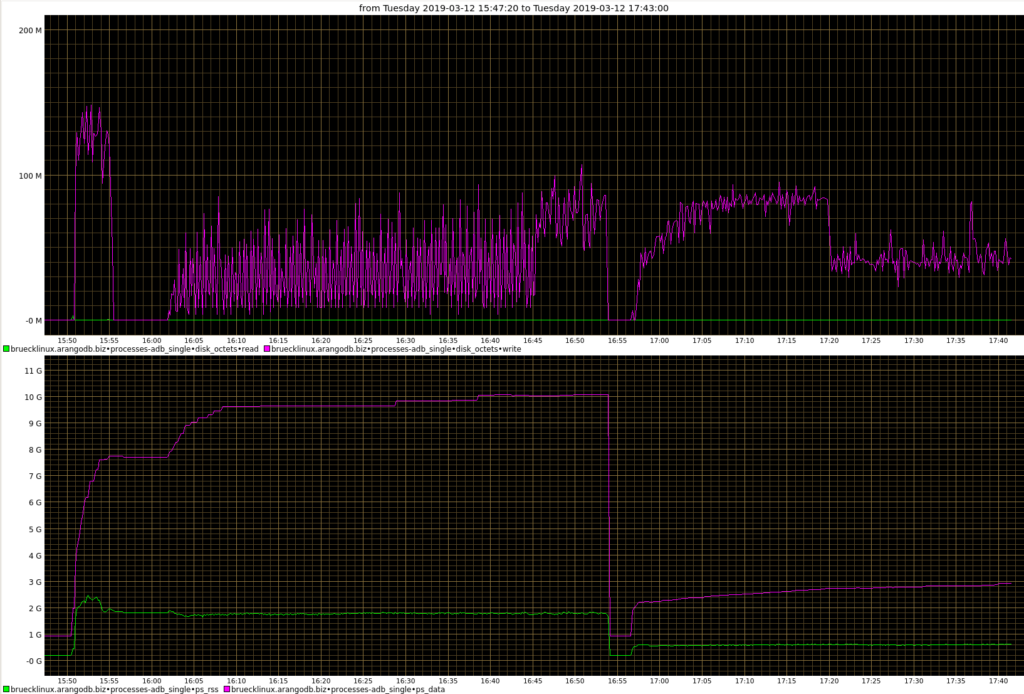
- 15:50 – Start bigger import
- 16:00 – Start writing documents of ~60 KB size one at a time
- 16:45 – Add similar second writer
- 16:55 – Restart ArangoDB with the RocksDB write buffer configuration suggested above
- 17:20 – Buffers are full, write performance drops
- 17:38 – WAL rotation
What you see in above performance graph are the consequences of restricting the write buffers. Until we reach a 90% fill rate of the write buffers the server can almost follow the load pattern for a while at the cost of constantly increasing buffers. Once RocksDB reaches 90% buffer fill rate, it will significantly throttle the load to ~50%. This is expected according to the upstream documentation:
[…] a flush will be triggered […] if total mutable memtable size exceeds 90% of the limit. If the actual memory is over the limit, more aggressive flush may also be triggered even if total mutable memtable size is below 90%.
Since we only measured the disk I/O bytes, we do not see that the document save operations also doubled in request time.