C++ Memory Model: Migrating from x86 to ARM
Estimated reading time: 18 minutes
Over the past years, we have seen a shift in processors from the previously dominant x86 architecture to the more energy-efficient (and often cheaper) ARM architecture. This trend is true for both consumer hardware, e.g., Apple’s M1 SoC and also server hardware, e.g. AWS’s Gravitron processor. Given that the ARM architecture has a more relaxed memory model, this might have some subtle impact on C++ programs…
With the introduction of multi-threaded execution in C++11, the standard also introduced a memory model. For many developers, this memory model is one of the least well-understood parts of the C++ standard and a common source of confusion. While an in-depth explanation of the C++ memory model is beyond this blog post’s scope, we will cover some basics and take a brief look at two of the most common hardware memory models and how the C++ memory model maps to these hardware models.
But first, let’s take a step back and consider why we need a memory model in the first place.
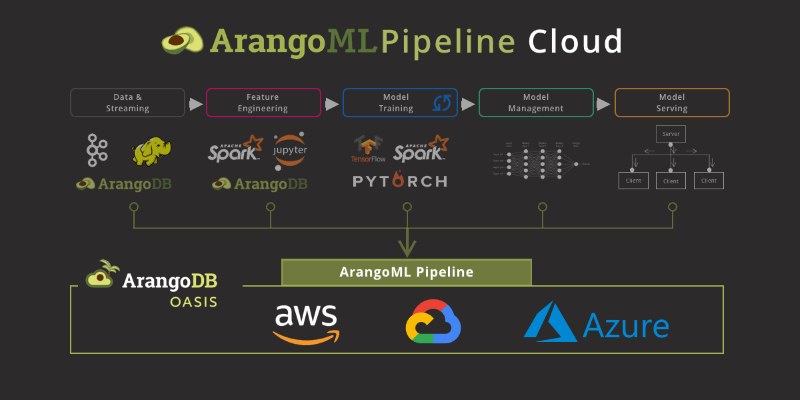
(more…)ArangoML Series: Multi-Model Collaboration
Estimated reading time: 8 minutes
Multi-Model Machine Learning
This article looks at how a team collaborating on a real-world machine learning project benefits from using a multi-model database for capturing ML meta-data.
The specific points discussed in this article are how:
- The graph data model is superior to relational for ML meta-data storage.
- Storing ML experiment objects is natural with multi-model.
- ArangoML promotes collaboration due to the flexibility of multi-model.
- ArangoML provides ops logging and performance analysis.


State of the Art Preprocessing and Filtering with ArangoSearch
Estimated reading time: 10 minutes
Just in case you haven’t heard about ArangoSearch yet, it is a high-performance Full-Text Search engine integrated in ArangoDB (meaning connected with the other data-models and AQL). Feel free to check out ArangoSearch – Full-text search engine including similarity ranking capabilities for more details.
In ArangoDB version 3.7 the ArangoSearch team added Fuzzy Search support (see the comprehensive article Fuzzy search by Andrey Abramov). With Fuzzy Search data preprocessing and filtering becomes even more important. In the upcoming ArangoDB 3.8 release, ArangoSearch efforts will be focused on improving this part. In this post I’m going to uncover some of the new features we are proud to present.
(more…)ArangoML Series: Intro to NetworkX Adapter
Estimated reading time: 3 minutes
This post is the fifth in a series of posts introducing the ArangoML features and tools. This post introduces the NetworkX adapter, which makes it easy to analyze your graphs stored in ArangoDB with NetworkX.
In this post we:
- Briefly introduce NetworkX
- Explore the IMDB user rating dataset
- Showcase the ArangoDB integration of NetworkX
- Explore the centrality measures of the data using NetworkX
- Store the experiment with arangopipe
This notebook is just a slice of the full-sized notebook available in the ArangoDB NetworkX adapter repository. It is summarized here to better fit the blog post format and provide a quick introduction to using the NetworkX adapter.
ArangoML Part 4: Detecting Covariate Shift in Datasets
Estimated reading time: 1 minute
This post is the fourth in a series of posts introducing ArangoML and showcasing its benefits to your machine learning pipelines. Until now, we have focused on ArangoML’s ability to capture metadata for your machine learning projects, but it does much more.
In this post we:
- Introduce the concept of covariate shift in datasets
- Showcase the built-in dataset shift detection API
ArangoML Part 3: Bootstrapping and Bias-Variance
Estimated reading time: 2 minutes
This post is the third in a series of posts about machine learning and showcasing the benefits ArangoML adds to your machine learning pipelines. In this post we:
- Introduce bootstrapping and bias-variance concepts
- Estimate and analyze the variance of the model from part 2
- Capture the metadata for this activity with arangopipe
ArangoML Part 2: Streamlining Machine Learning Workflows
Estimated reading time: 1 minute
This post is the second in a series of posts about machine learning and showcasing the benefits ArangoML adds to your machine learning pipelines. In this post we:
- Introduce machine learning concepts
- Demonstrate basic model building
- Log a model building activity with arangopipe
ArangoML Part 1: Where Graphs and Machine Learning Meet
Estimated reading time: 4 minutes
This post is the first in a series of posts introducing ArangoML and showcasing its benefits to your machine learning pipelines. In this first post, we look at what exactly ArangoML is, with later posts in this series showcasing the different tools and use cases.
(more…)Fixing a Memory Leak in Go: Understanding time.After
Estimated reading time: 2 minutes
Recently, we decided to investigate why our application ARANGOSYNC for synchronizing two ArangoDB clusters across data centers used up a lot of memory – around 2GB in certain cases. The environment contained ~1500 shards with 5000 GOroutines. Thanks to tools like pprof (to profile CPU and memory usage) it was very easy to identify the issue. The GO profiler showed us that memory was allocated in the function `time.After()` and it accumulated up to nearly 1GB. The memory was not released so it was clear that we had a memory leak. We will explain how memory leaks can occur using the `time.After()` function through three examples.
(more…)Get the latest tutorials,
blog posts and news: